• Documentary: The Madagascar Journals (2012) are now complete

    A man who travels through the south of Africa and Madagascar. What makes this series special is not only the high production quality of the video travel documentary of a private person but the highly personal style of what's going on in his head while he meets quite unique people along the way. Something that you won't see in an ordinary documentary.

    "The Madagascar Journals" by Matt Kresling on youtube:

    Part 1, Part 2, Part 3, Part 4, Part 5, Part 6, Part 7, Part 8.

    Trailer:


  • Converting between sRGB and linear values

    The sRGB color space used for example in 8 bit images has to deal with the nonlinear brightness perception of human vision. It does this via a nonlinear mapping between the binary brighness value and the actually displayed brightness. It basically is a modified form of gamma encoding with a gamma value of approximately 2.2.

    In order to add two images by actual brightness we need to convert the sRGB brightness values of the raw image data into linear brightness values, add them and then convert them back into sRGB values in order to display them on monitor devices [1].

    more


  • Combined linear and logarithmic plot with quantiles

    The human perception of time is logarithmic. We have words like second, minute, hour, day, week, month, year, decade, century, millennium etc. to refer to exponentially increasing time frames. But despite this fact, plots over time are usually in linear scale. When looking at values like the CPU load, the frame update time of a game, or the response time of a server, the last few seconds are of interest but at the same time the course of the last hours or days are valuable information. In order to display this range of time in appropriate detail, a linear plot is not sufficient.

    Instead here, I introduce a combined linear and logarithmic plot. Short times are displayed in a linear time axis and longer time frames in (compressed) logarithmic time axis.

    screenshot

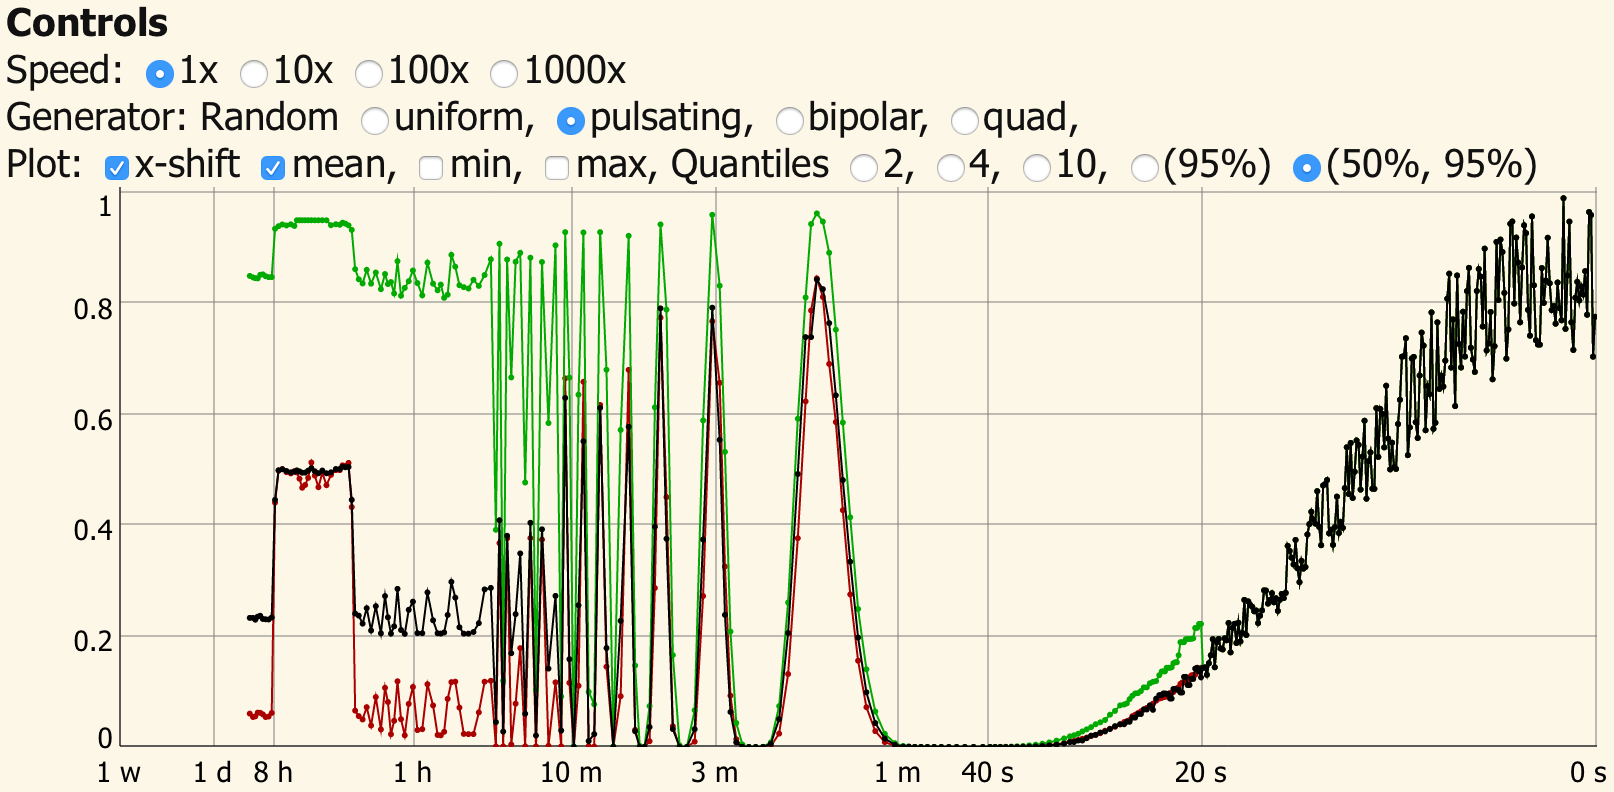
    Example of the linear and logarithmic plot. Read the full article for a live demo.

    One problem that arises when plotting is that in a week there are 604800 seconds. This would make updating such a plot very time consuming and impractical for responsive applications. To solve this, I reduce the time values in a logarithmic fashion by recursively combining two values to a single one. Combining two values to a single one is simple for the mean, the minimum and maximum value of a time series. In this case, the average, largest and smallest value of both samples which are to be combined are kept.

    In the case of CPU load, the minimum over a time period will always be 0 %, the maximum will be 100 % and the mean value does not express sufficiently how heavily e.g. a web-server is loaded. Here, another value like the 95th-percentile of the load histogram gives an idea how much time the server spent under high load. The median (or 50th-percentile) usually coincides well with the mean, except when the distribution function is heavily skewed. In the case of a web-server the median can give an idea of the base load by background processes. Combining two histograms, however, requires a bit more thought than simply calculating the average of two values.

    Read on for a live demo and illustrations which explain the method.

    more


  • Variants and optionals in microcontrollers

    The article about futures we have an interesting construct: a structure which may or may not hold a value.

    When dealing with errors we have a similar situation. A function may or may not return a value or it may return an error value. We can make a structure optional_variant which can hold all of these values.

    This results in three states for optional_variant:

    • nothing
    • value
    • error

    for an object which holds the corresponding data and two different types of data - a variant.

    A possible usage is a function which returns an option

    // Read a character.
    optional_variant<char, int> get_char()
    {
        // Read the character which might fail.
        char c = ... read character here ...
        int errorvalue = ... read errorvalue here ...
    
        if( errorvalue == 0 ) {
    
            // Ok, we have a character.
            return make_value<char, int>( c );
    
        } else if( errorvalue == 1 ) {
    
            // We have no character.
            return make_nothing<char, int>();
    
        } else {
    
            // An error occured.
            return make_error<char, int>( errorvalue );
    
        }
    }
    

    and code which evaluates the optional/variant

    optional_variant<char,int> co = get_char();
    
    switch( co.what() )
    {
        case co.e_value:
            Serial.println( "Character: " );
            Serial.println( co.get_value() );
        break;
    
        case co.e_error:
            Serial.print( "Error: " );
            Serial.println( co.get_error(),  );
        break;
    
        case co.e_nothing:
            Serial.println( "Nothing." );
        break;
    }
    

    .

    more


  • Documentary: The Madagascar Journals (2012)

    A man who travels through the south of Africa with the goal of reaching madagascar:

    "The Madagascar Journals" from Matt Kresling

    Part 1, Part 2, Part 3, Part 4, Part 5, Part 6, Part 7, Part 8. Trailer:

    This series consists of 8 episodes. Thus far 6 have been released.

    Unlike most documentaries you see about Africa, this travel documentary is a first-person account and Matt seeks out very personal encounters with the locals i.e. instead of a hotel he often stays at their home for some time.


Page 1 / 1